Overview
One of the marketing challenges we initially faced after merging to become Datalytyx was how to increase our visibility online. Our friend, Ian Cleary of razorsocial.com, kept telling us that we needed to create valuable content. That would increase our SEO rankings and get people interested in the work we do.
After a lot of thought, we realised that our technical team was probably the greatest untapped mine of content that we had access to. Our team is made up of highly skilled, very intelligent people working with cutting edge systems for digitising, transforming and analysing data.
So, the question became, how do we motivate them to create content? We settled on a monthly cash prize – one prize for the most content submitted within the month and one prize for the best performing post for that month. This meant that while they may not have much control over website traffic, they would have control over the extent to which they participated. The team got on board quickly, not so much for the cash prize but mostly to compete with each other. The prize was just the icing on the cake.
Now, we had a problem on the marketing side. The question for us was, how do we monitor each author’s success? We were already using Google Analytics to track our website traffic because it’s free, useful and reliable. We also decided to use Tableau to visualise the data. Datalytyx is partnered with Tableau because it allows us to combine different sets of data easily (they have connectors to some of the most commonly used databases) and create rich, interactive visualisations which can be automatically updated.
So here’s what we did to create a Blog Scoreboard using Google Analytics and Tableau.
Set up a Google Analytics account.
Hopefully, you’ve already taken this step. If not, don’t worry. There’s plenty of online resources – such as this link – to learn how to set up a Google Analytics account and implement your tracking code to collect data on your website. It’s fairly easy.
Create a custom dimension to track the author of each blog post.
Google analytics does not automatically track the author of a page. So, you’ll need to create a custom dimension to collect this data.
First, log into your GA account and go to the Admin menu. Under the Property column, click Custom Definitions and then Custom Dimensions.
Click the + New Custom Dimension button.
Name it Author and set the Scope to Hit. Check it as Active and click Create. Take note of the Index number next to Author. If this is your first custom dimension it should be 1.
In fact, www.vsellis.com has a great post on author tracking and you can also go to developers.google.com for more information on custom dimensions.
Creating the metric on GA will not automatically tell Google to start collecting this from your site. You need to get your hands dirty with a little bit of PHP code. Don’t worry, it’s not as scary as it sounds. First, go to your GA Tracking Code by clicking Tracking Info > Tracking Code under the Property column.
Copy it and paste into Notepad and remove the script tags at the beginning and end of the code. Then, add this line of code above ‘ga(‘send’, ‘pageview’);
ga('set', 'dimension1', author.name );
If your author dimension is different than ‘1’ change ‘dimension1’ to ‘dimensionX’ (replacing ‘X’ with the correct Index number).
The final code should look like this…
Save the notepad file as ‘google.js’. Now, you need to get to your site’s file directory via FTP. You can use Filezilla which is an open source FTP software. Once you’ve connected to your site’s directory through FileZilla, navigate to the js directory. Transfer the google.js file to the js directory. Now, navigate to your functions.php file, open it and add this code…
function

google_load_file()

{

$this_post = get_queried_object();

$author_id = $this_post->post_author;

$name = get_the_author_meta('display_name', $author_id);

wp_enqueue_script( 'author-tracking', get_stylesheet_directory_uri() . '/js/google.js', array(), '1.0.0', true );

wp_localize_script( 'author-tracking', 'author', array( 'name' => $name ) );

}

add_action( 'wp_enqueue_scripts', 'google_load_file' );
Save the file with the changes. That should do it, although you unfortunately won’t know if it’s working right away: it could take Google Analytics 24 hours to show the results.
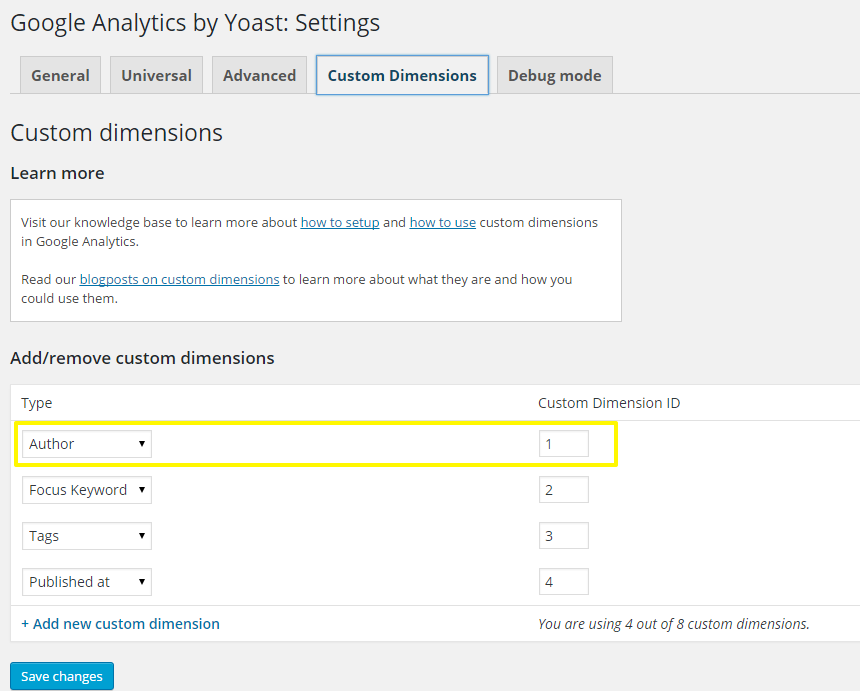
Another way of doing this without the hassle of modifying code and accessing your directory via FTP is to use Google Analytics by Yoast Premium. This is a one-off cost for $89. This will pass the dimensions that you specify to Google Analytics without you having to touch any code. Just install the plugin, visit the settings page and click the Custom Dimensions tab.
Click the +Add new custom dimension link. Select Author from the drop down menu and enter the Google Analytics custom dimension index number in the ID field. Then save the changes.
Analyse the data
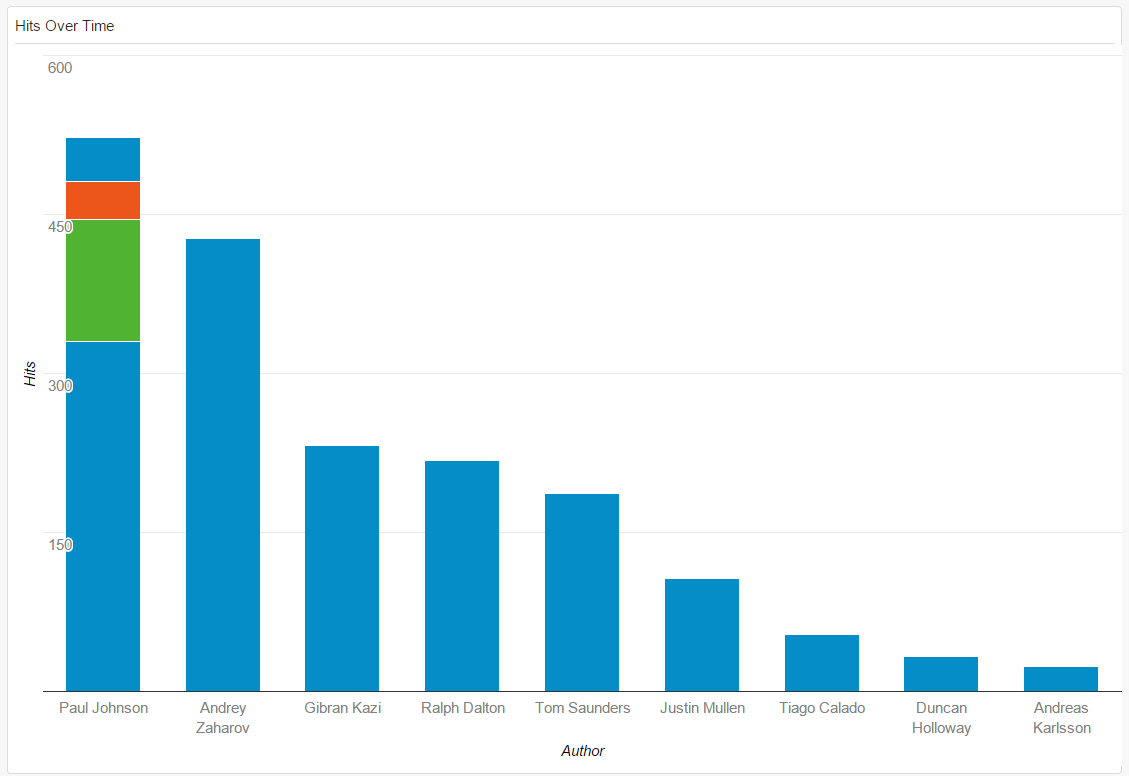
Once you’ve started collecting information on your blog posts, you can analyse the data in Google Analytics by creating dashboards and custom reports based on your custom dimension (Author) and the pageviews that each author has had.
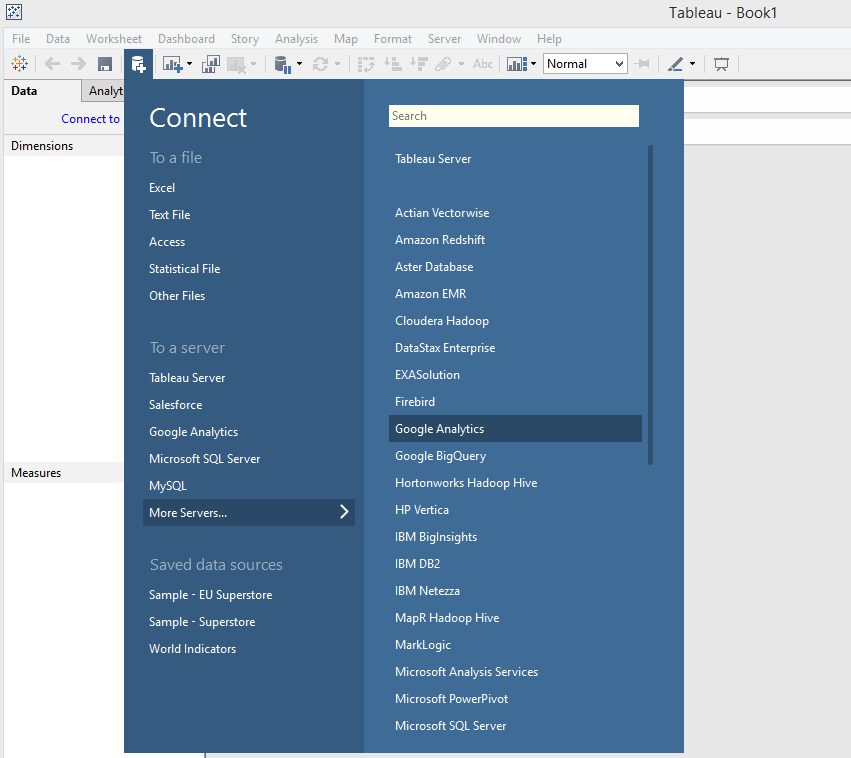
You also have the ability to export the results into a CSV or Excel file. However, I’ve never had to do this because I use Tableau which has a built-in connector to Google Analytics.
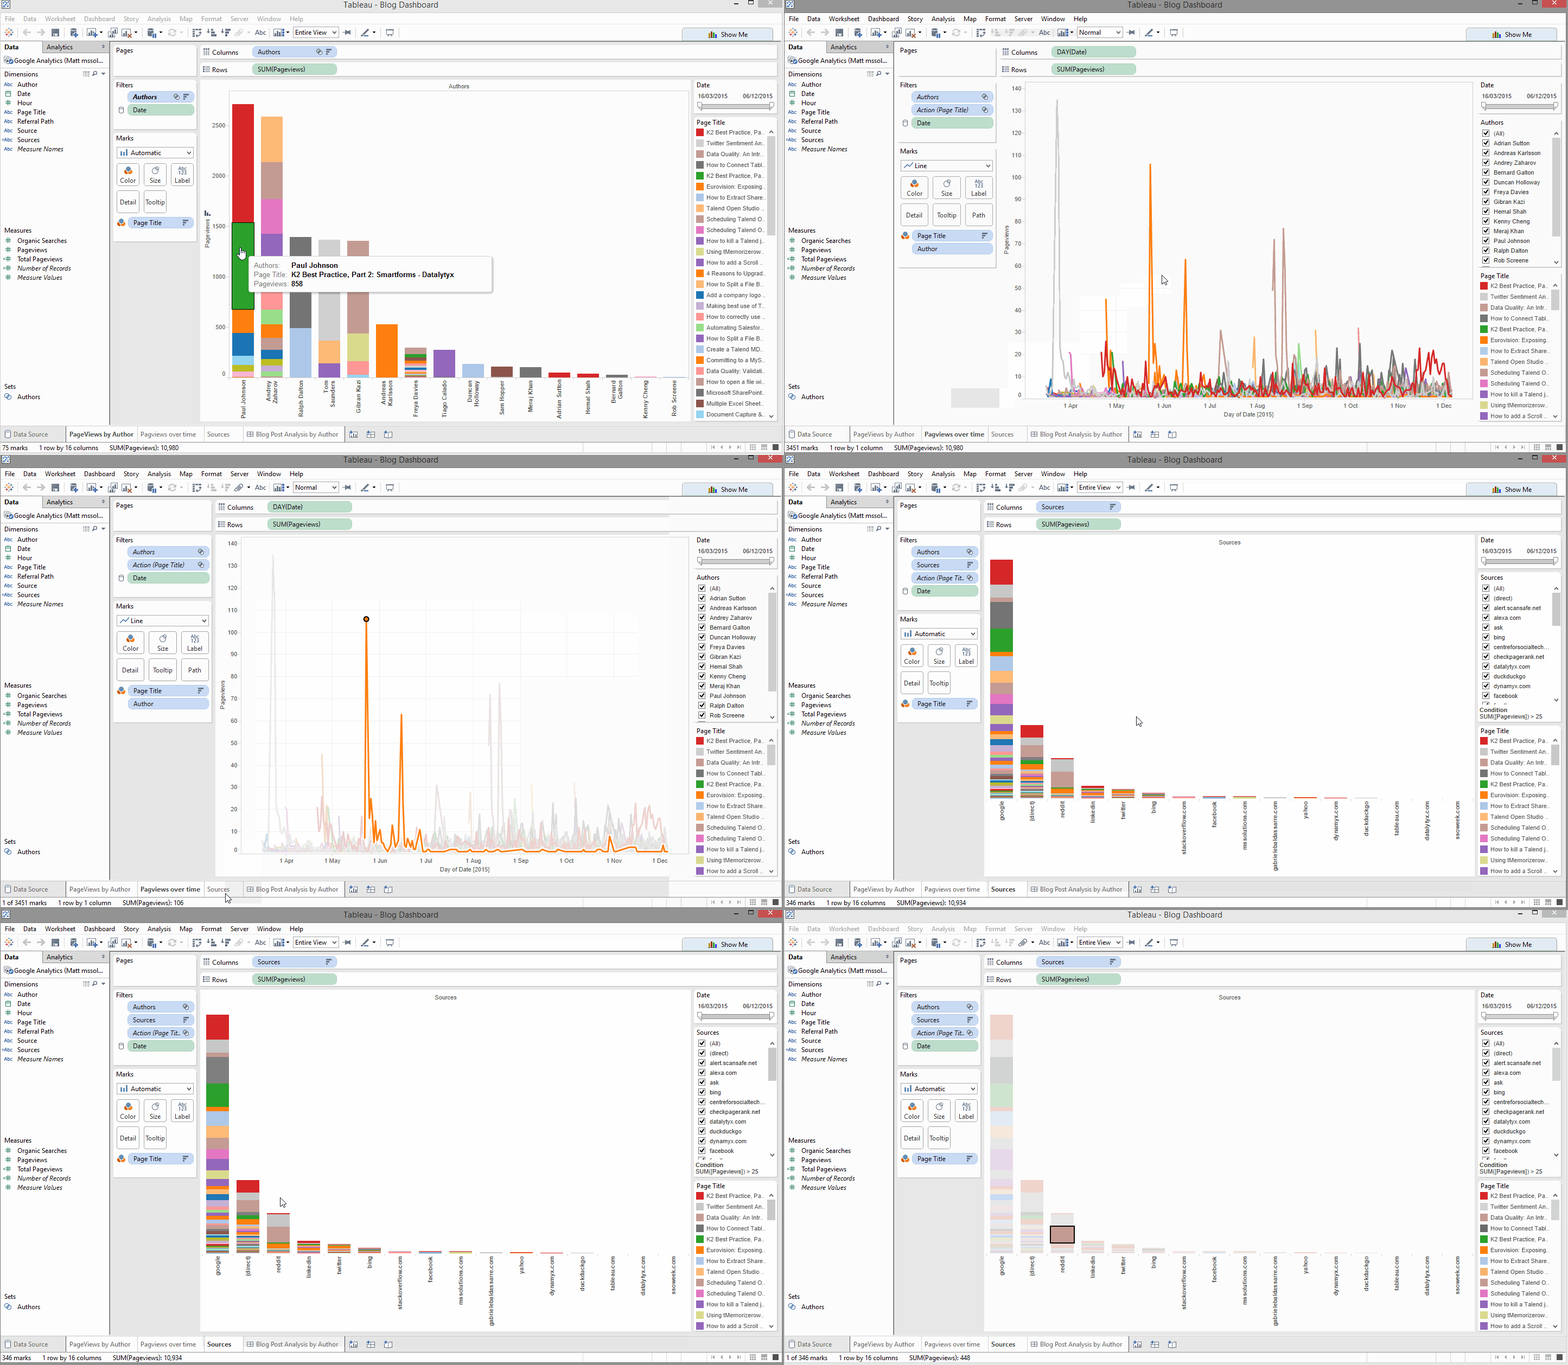
In Tableau, on the Data Source tab, set your Date Range as well as your dimensions and measures.

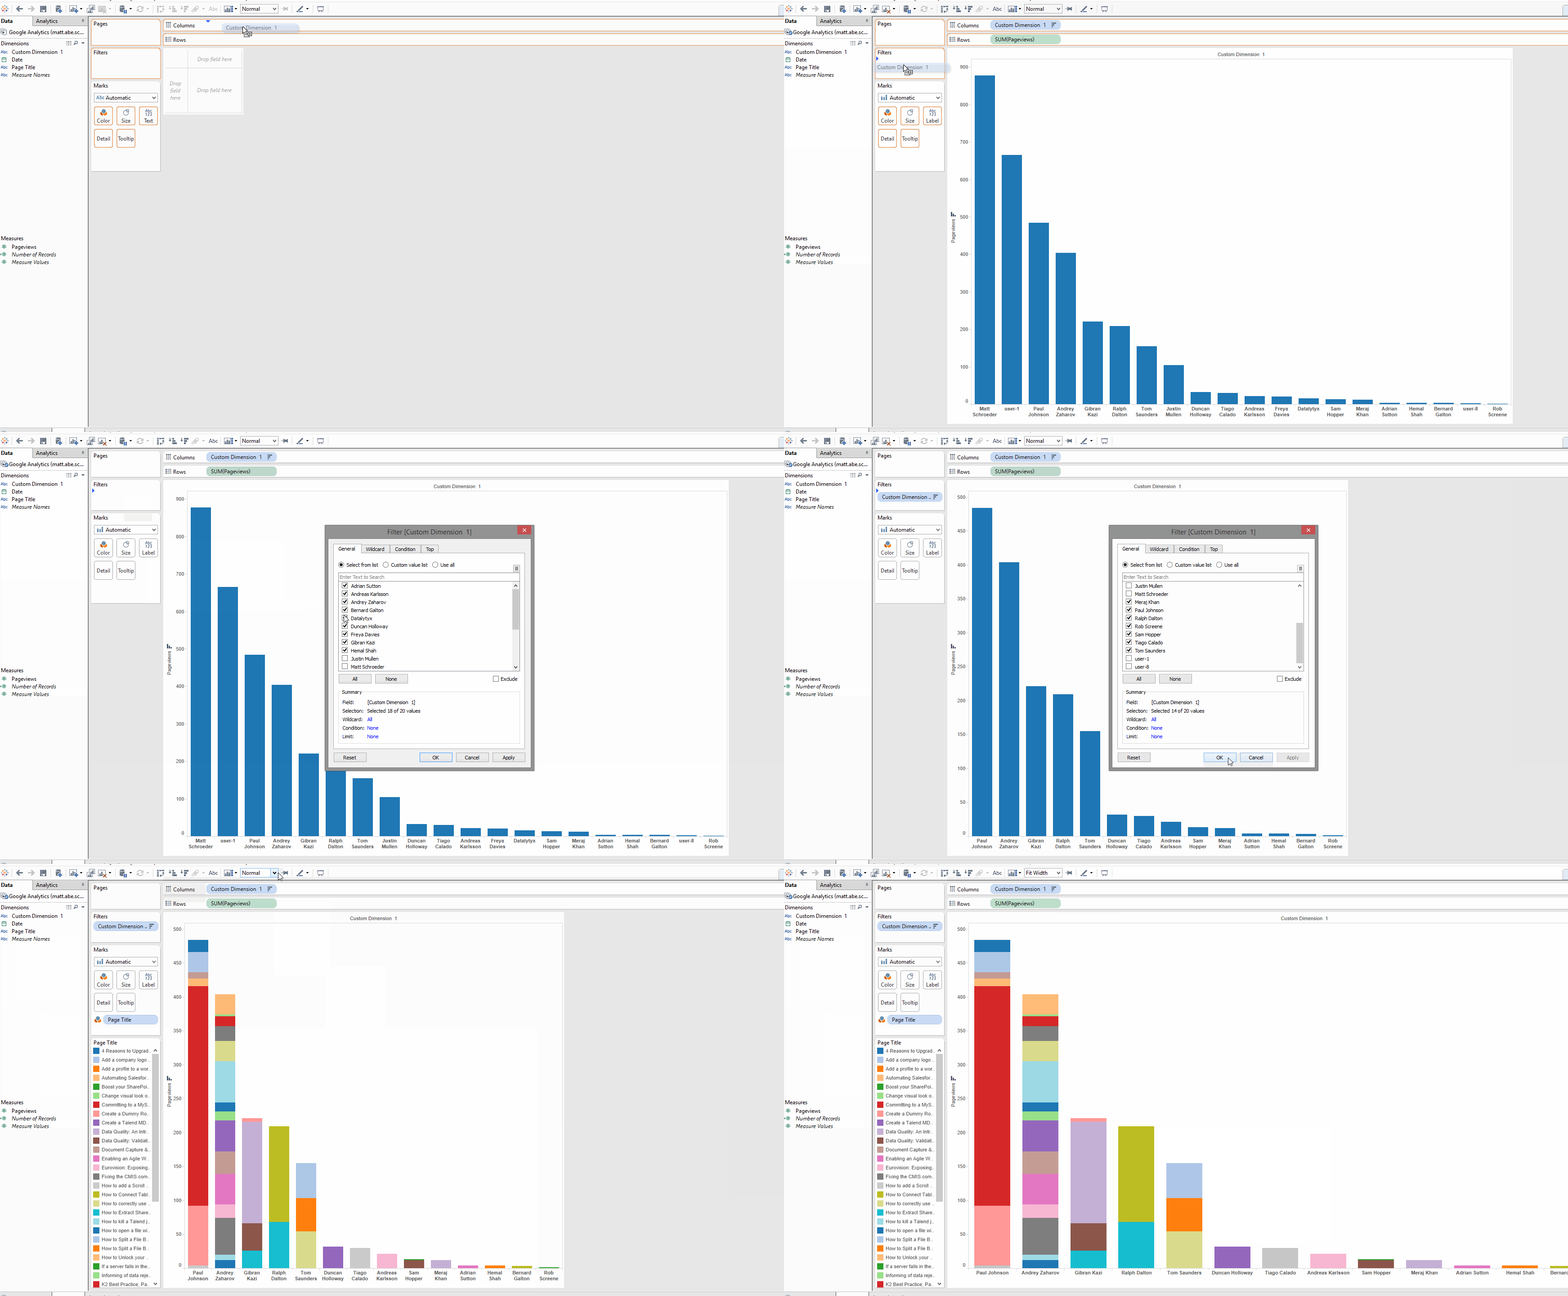
Then go to Sheet 1 and drag your Custom Dimension to the Columns shelf. Drag your Pageviews to the Rows shelf. Do any other filtering or customisation that you want.
I’ve create a Workbook that analyses the number of pageviews by author, the number of pageviews each blog received over time, and the referral sources (how the visitors found the blog post, i.e. Google Search, Twitter link, etc).
I’ve published this to our own Tableau Server and set it to automatically update the data from Google Analytics. Our team has access to the dashboard so they can monitor their own statistics online. Checkout my dashboard on Tableau Public. If you have any questions or suggestions, please post a comment or send me an email at matt.schroeder@datalytyx.com.


If anyone is interested, I’ll be releasing a new blog on working with multi-currency SalesForce instances in Tableau soon.