This is another post in our series of Datalytyx blog posts on useful diagnostic queries for Snowflake. This time round we’re looking at loading data into Snowflake and how to check for inefficiencies in data loading.
TL;DR this query will help you spot inefficient file loading, read on to learn more…
Intro
The Snowflake docs have plenty of information on how to load data efficiently and quickly, which we can summarise as:
- pre-process the files to get the right
- chunk size
- file type
- compression, and
- configure your loading warehouse properly.
(This is mostly focused on bulk loads rather than Snowpipe, but many of the same optimisations can be applied.)
Before going further, it’s worth briefly covering how Snowflake COPY INTO statements load data into tables. When we load data, Snowflake finds the files it needs to load (based on whether they’ve already been loaded, the path they’re in etc.) and starts processing them – 8 files at a time on each active warehouse in the cluster. Straight away we can see the first issue people run into: larger warehouses have more compute power but will still only load 8 files in parallel, so it’s best to scale out rather than up i.e., allowing your warehouse to expand to 4*XS will be better than . In fact, it may be worse than that – an ingestion cluster based on XS nodes might load data just as fast as one based on M modes – but the medium cluster will consume credits 4x faster! We want to keep those 8 file-loading threads busy, so we want at least 8 files so each thread has something to do – so we don’t want to load one large file at a time. On the other hand, there’s of course some overhead associated with opening each new file, so we don’t want the files to be too small either… To find the sweet spot we can follow Snowflake’s recommendation for file size – “roughly 100-250 MB (or larger) in size compressed”.
Preparing your data
That’s the theory, but what about the real world? We can immediately ignore a whole subset of data loads – if the business requirement is that 10 rows have to be added to table A each day, then there’s not much we need to do in terms of file size and compression (although Snowpipe could help with automation!). We can focus on high-volume data loads and try to apply the rules above.
How we actually apply the rules depends on the mechanism used to load the data – Snowflake have some recommendations for manipulating files but if you’re using an ETL or ELT tool there may be some configuration you can change there.
Configuring the loading warehouse
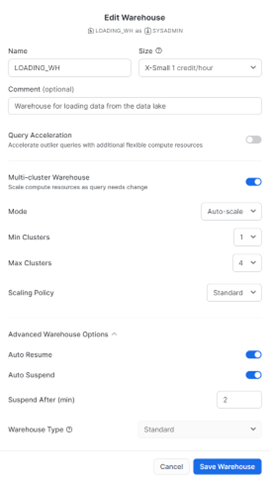
As above, we want to scale out not up. As long as you have the “Enterprise” edition or above, you’ll have these options for “Multi-cluster Warehouse”:

(UI Path: Admin -> Warehouses -> click ‘Edit’ on the relevant warehouse. You’ll probably need to use the SYSADMIN role)
Here you’ll see a decent configuration for a data-loading warehouse: each node is XS, but we can scale out from one to 4 to load up to 32 files in parallel if needed.
It’s worth noting too that this configuration isn’t necessarily what you might want to use for data science queries or Power BI, so it’s generally better to use a dedicated warehouse for data loading with the appropriate ‘shape’. That’s one of the benefits of Snowflake’s architecture, in that we can design warehouses for data loading, data science, visualisation etc. based on their specific requirements.
Finding issues
Unless you’re a lone wolf Snowflake operator, you probably don’t control all the data that flows into Snowflake, and you’ll need a way to spot potential inefficiencies in how people and processes load data. Once you’ve spotted any issues it’s a question of finding the right person in the business and discussing with them whether there’s a more efficient way to load their data while meeting the same business requirements.
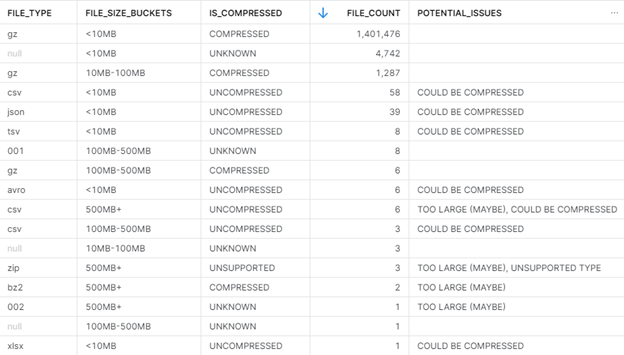
This query https://github.com/datalytyx/snowflake-audit/blob/main/file_loading_issues.sql is an example of one that might help: it simplifies the COPY_HISTORY view by adding some explanatory labels and aggregating down to a summary table.

Here we can see there isn’t much to be worried about – the vast majority of the files being loaded are small and compressed. We could perhaps save some credits by aggregating those smaller files into larger blocks and loading less frequently, but I know that most of the data is trickling in slowly and aggregation like that would mean loading data every few days, which wouldn’t work for our business. There are a handful of large uncompressed files, but on further inspection I can see this was a test process that was later refined – good job team!
In general, the easiest issue to spot is large files – if you see files over 1GB then consider splitting it up before loading to reduce the credit consumption. The reduction in credit consumption could be as high as 85%.
Conclusion
If you’ve been using Snowflake for a while, try running the query above to see if you can spot any file loading blunders. If you do, you can try some of the steps above to optimise your Snowflake execution, or of course you can contact us – we include this analysis in our Snowflake Audit Service where we have optimized by consumption of credits by up to 70%, resulting in more bang per credit. We work on projects like this all the time and can help you to find and fix issues like this in your data environment.
This blog is written by Dan Martyr, Datalytyx Solutions Architect.


0 Comments