Snowflake is the best cloud data platform around. So why do businesses feel like they’re spending too much for what they’re getting? Snowflake is supposed to make data valuable, not a costly liability.
So what’s the problem?
Sub-optimal queries.
It could be a lot of different things, but mostly it’s ‘crappy’ queries.
Some users don’t have a lot of SQL knowledge. So, they don’t know what their bad queries are doing to their Snowflake credits. They make mistakes and do things that have unintended financial consequences.
If a query retrieves tens of millions of rows on a regular basis, that will take a huge chunk out of your credits. If a user forgets to a do a join in their query, it will run and run and run. It could run for hours, and still not deliver the data they were looking for. If a user makes queries with bad syntax, those little queries add up to one big bill.
So how do we stop that from happening?
Monitor.
Self-service is fantastic and should be the strategy for most, if not all businesses. But monitoring your consumption is going to be a necessity. Monitor to make sure that self-service doesn’t lead to costly service.
So how do we monitor all this?
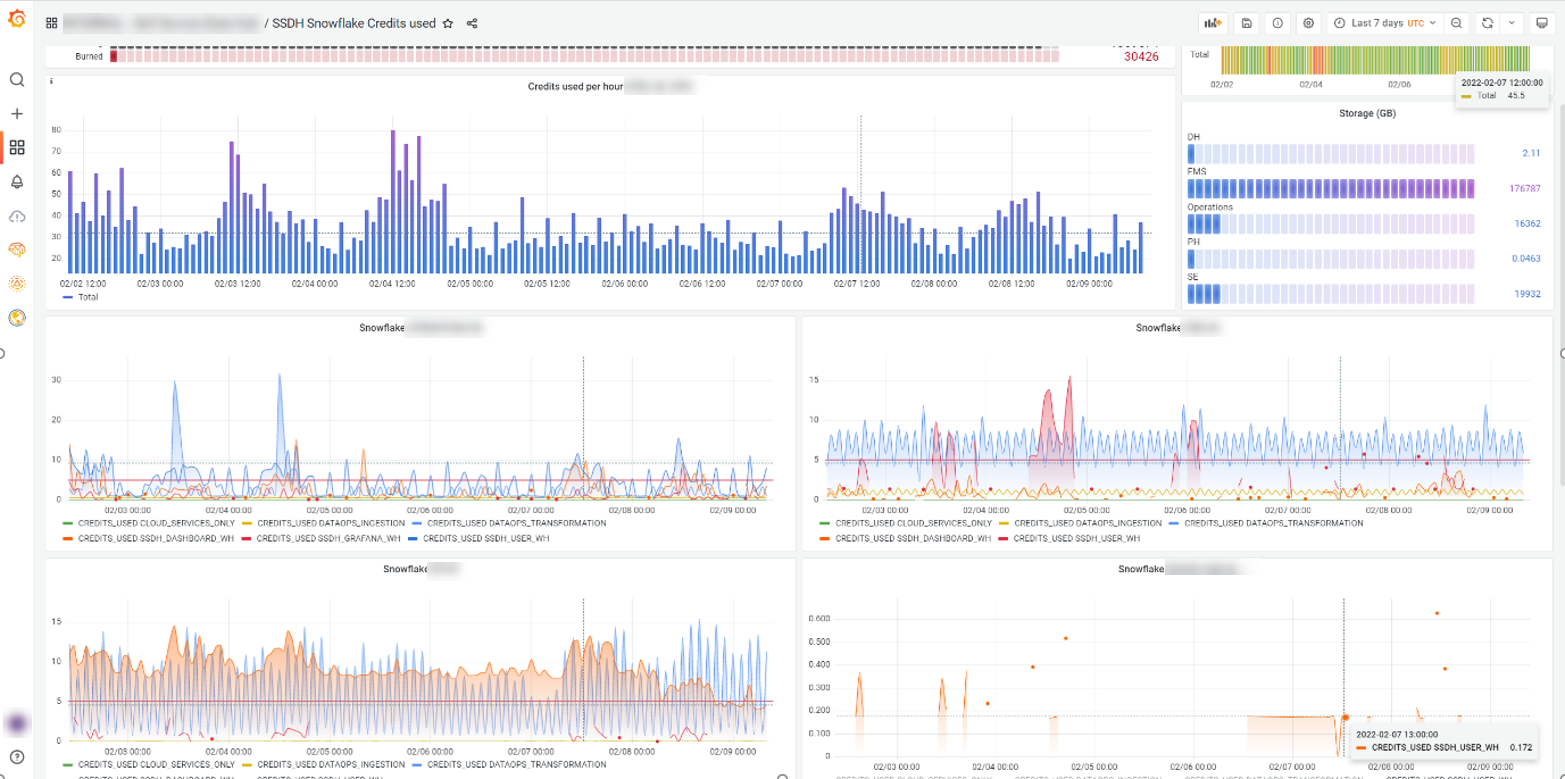
Visualize Snowflake’s Account_Usage schema logs.
This is a great way to see where query time and credits are going. It’s easy to hook any BI tool up to Snowflake. But if you have a lot of data and you need it fast, you need to look at some special tools.
We maintain and support Snowflake for clients with a wide variety of data needs. Our bigger clients run hundreds of millions of rows a day. And they need to see this data in real-time.
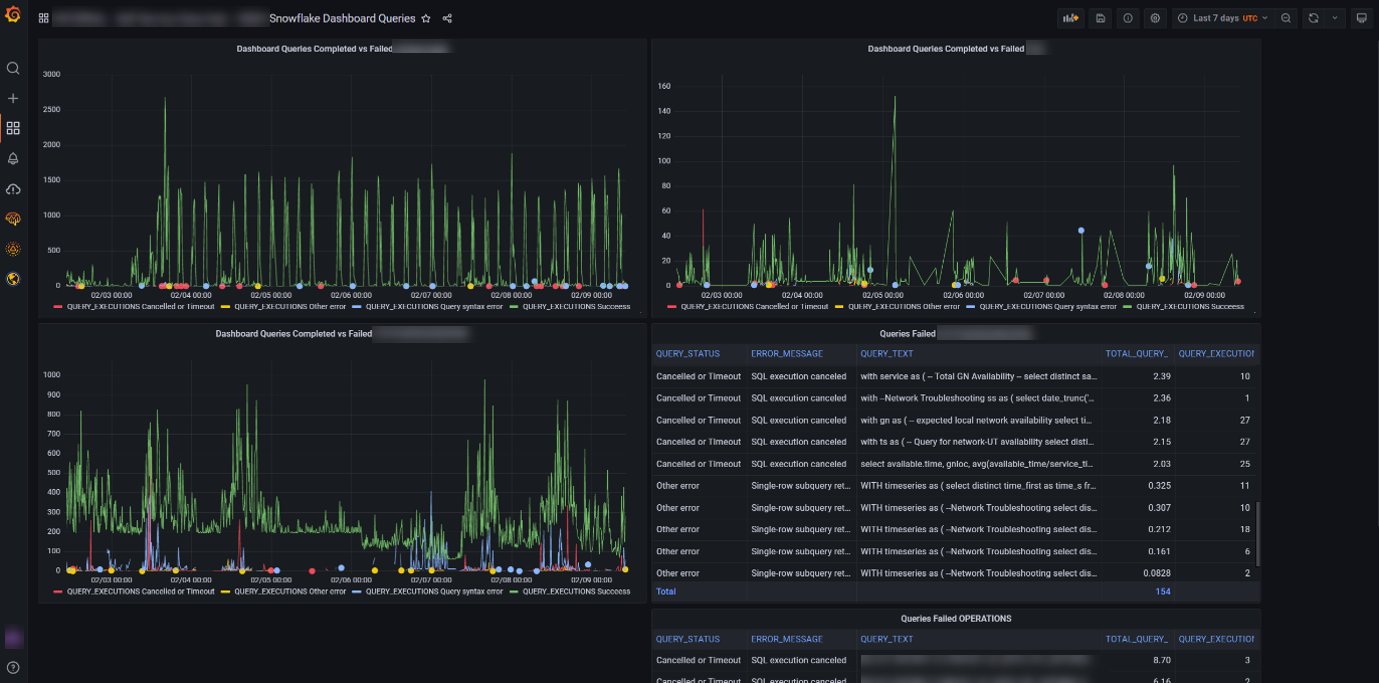
For them, we use Grafana. It’s designed for observing your technology stack’s metrics. It highlights the operational issues that could be costing you money in real-time.

This shows how many queries are being run, how long they take, and whether they were successful or not.
Okay, let’s say we have all this information. What should we do with it?
Fine tune Snowflake like an artist.
We noticed at one client, that some users had inefficient dashboards running. They were pulling Gigabytes of data and taking hours to complete. This was consuming way too many Snowflake credits.
After diagnosing the problem, we set query timeouts on consumption warehouses. And we set a weekly credit limit with a warning to stop runaway credit burns. If a query takes longer than 4 or 5 minutes, the user will have usually moved on anyway.

We also look at warehouse load, startup provisioning overhead and user query performance. This tells us if we should scale up or scale down a warehouse.
In our experience, the smaller the warehouse, the faster it starts up and fewer credits get burned. But we need to balance this against how fast the queries run. We need to take into account how well the warehouse caches are performing. We can query this from the account_history schema. It’s also visible on the Snowflake worksheets UI.
Okay, so now we’re done, right? Nope.
Keep on Monitorin’ (in real-time)
Keeping your Snowflake humming along is an ongoing process. Your data is going to change and evolve in nature, speed, and volume. Your users’ demands will also change as they grow to trust that you are providing a timely, good quality source of truth.
Keep looking at the peak load. Use this to fine-tune the scale-out Max clusters and scaling policy setting. Use ‘automatic scale-out’ to handle peak concurrent loads. Use the economy setting to scale out when concurrent loads are likely to queue for a few minutes.
With real-time visualization we can see the response to our actions to save credits. If too many users are receiving time-outs, we can scale back up. We can also fine-tune the most critical queries to improve their performance.
Now Snowflake isn’t burning up credits. It’s performing with little to no waste. And it’s saving our clients money today and in the future as their data grows.
So monitor your Snowflake. Get the value you were expecting. Snowflake is the best cloud data platform around…if bad queries and settings don’t sabotage you.


0 Comments